
Data Visualisation
Visual Insights, Powerful Decisions
Transform raw data into compelling visualisations that drive impactful business decisions. Our approach combines advanced data analysis techniques with intuitive visual tools, helping you uncover hidden patterns and build a foundation of truth and clarity.
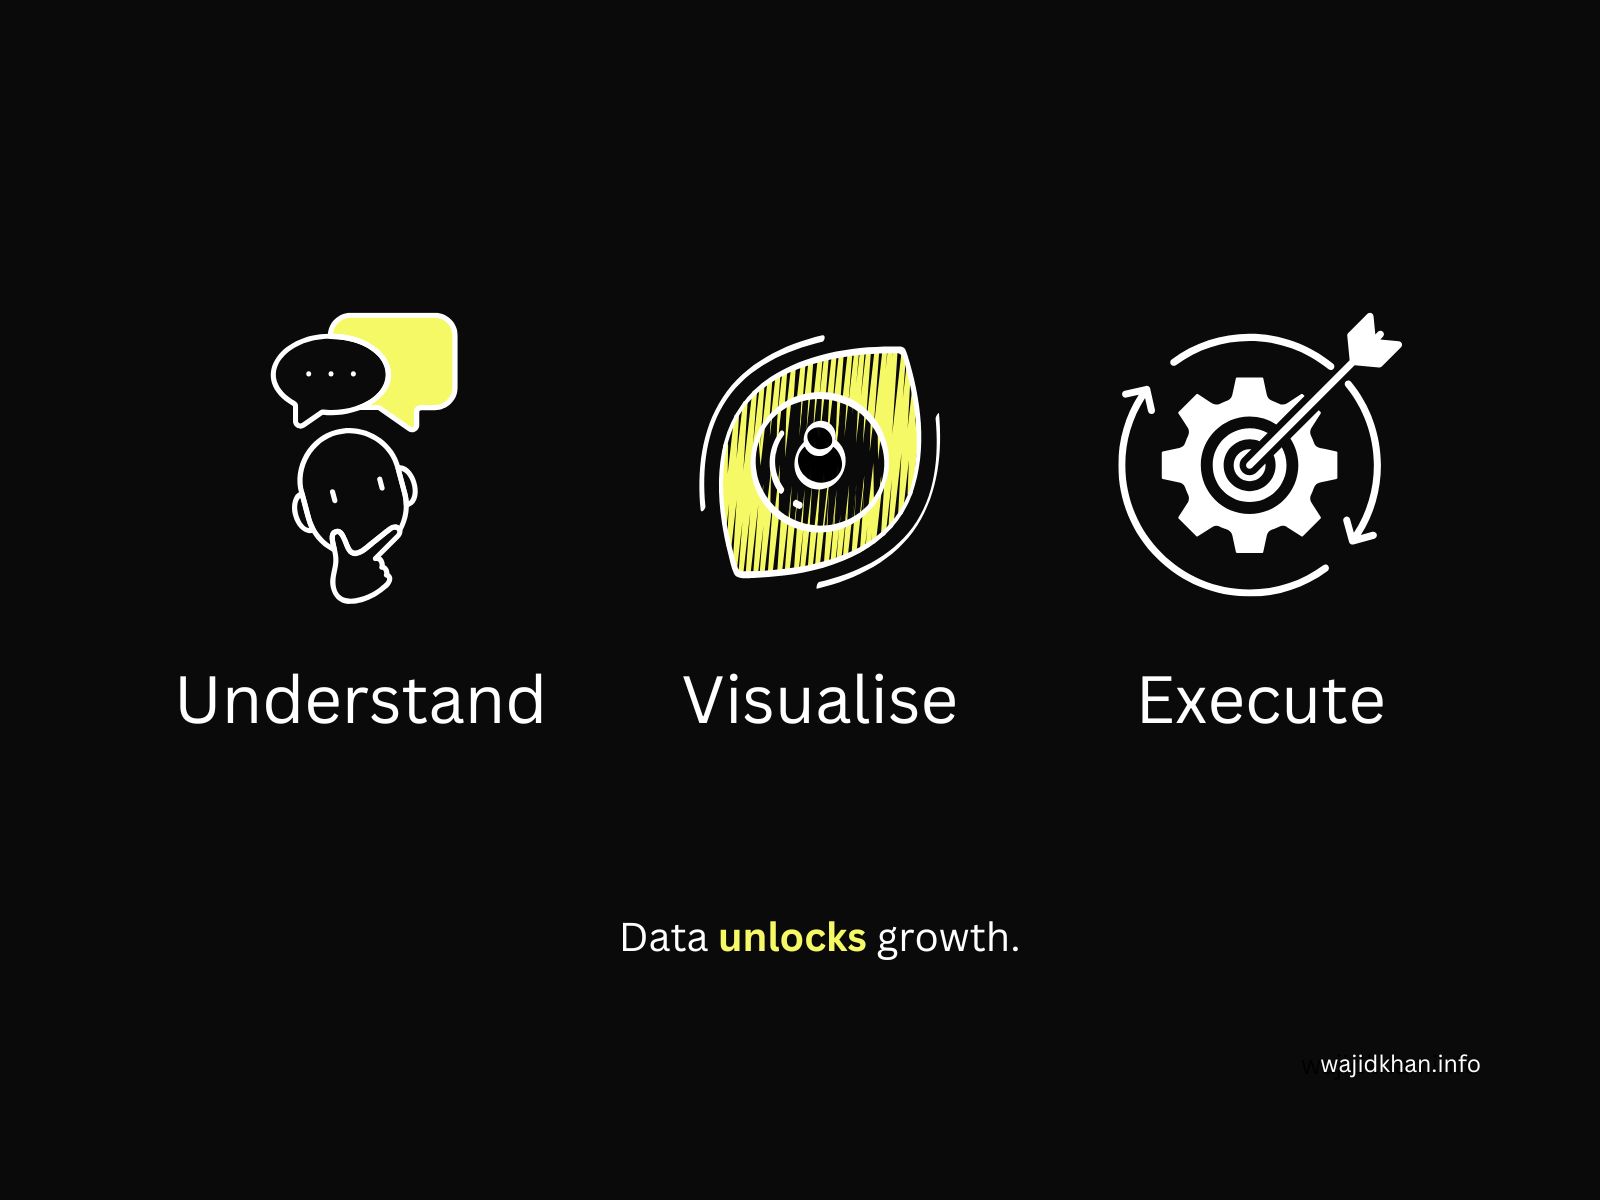
1. Understand
Start with the data you have. Identify what insights are hidden within structured, semi-structured, and unstructured data. From years of archived emails to operational logs, every dataset holds potential value. Tools like Python, spaCy, NLTK, and Pandas lay the groundwork for robust analysis.
2. Visualise
Turn data into stories. Create interactive dashboards, infographics, and predictive charts that highlight key metrics. Platforms like Matplotlib, Seaborn, Plotly, Tableau, and Power BI bridge the gap between raw numbers and actionable insights.
3. Execute
Insights must lead to action. Use visualised data to make informed decisions, optimise strategies, and unlock new opportunities. Data visualisation is not the end; it’s the beginning of your business’s next chapter.
Use Cases
Email Archives Analysis: Analyse structured and unstructured email data spanning 10+ years. Discover trends, customer concerns, and operational inefficiencies through comprehensive visualisation techniques.
Customer Journey Mapping: Use data visualisation to trace customer interactions across touchpoints. Identify opportunities to improve user experience and boost retention.
Sales Performance Dashboards: Combine historical sales data with real-time analytics to create interactive dashboards. Pinpoint top-performing products and regions.
Process Bottlenecks: Visualise workflows and detect inefficiencies in production or service delivery. Leverage these insights to refine processes and improve output.
Employee Engagement: Develop dashboards that monitor employee productivity, identify burnout risks, and ensure workforce optimisation.
Market Intelligence: Visualise market trends using data from social media, reviews, and competitor analysis. Make data-driven marketing and product decisions.
Product Development: Leverage usage analytics and customer feedback to inform new features and improve existing products.
Risk Heatmaps: Build visual heatmaps to identify and assess business risks. Use predictive analytics to prepare for potential challenges.
Expense Tracking: Visualise financial data to find cost-saving opportunities and make smarter budgeting decisions.
Environmental Impact: Use data visualisation to monitor sustainability metrics, reducing your business’s environmental footprint.
Data visualisation transforms complexity into clarity. Let your data become the foundation for confident, informed decisions.